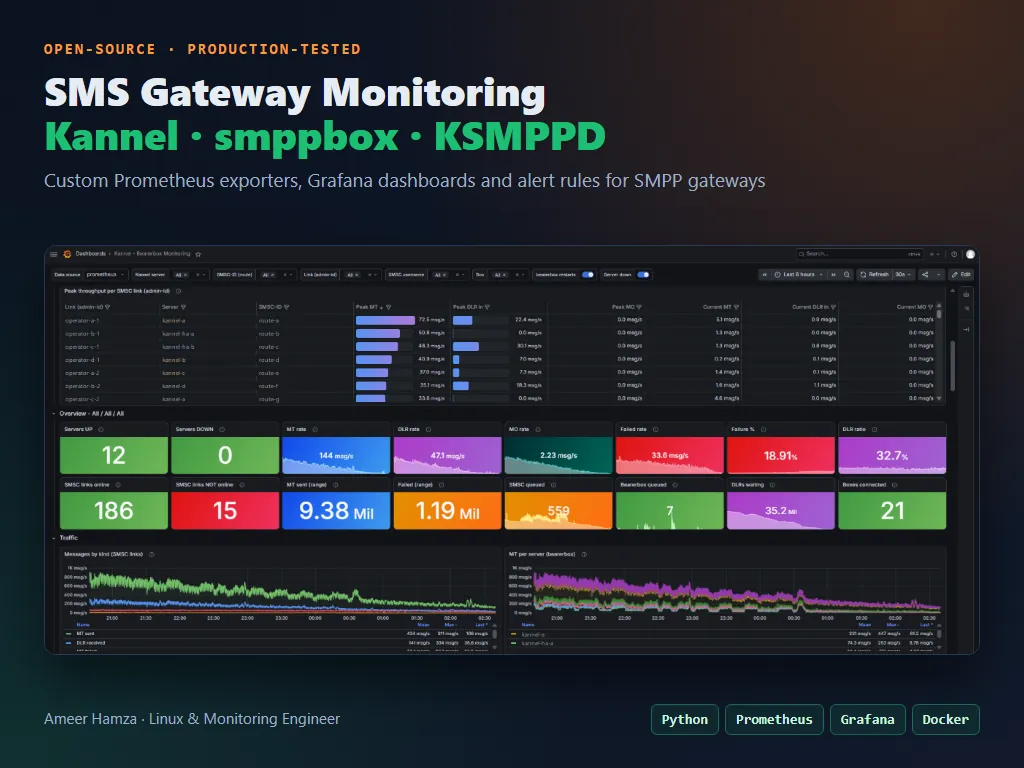
Results at a glance
- 3exporters: Kannel bearerbox, Kannel smppbox and KSMPPD
- 70+panels per Grafana dashboard, from fleet view down to one customer
- 29ready-made alert rules (11 + 9 + 9)
- 0changes needed on the gateways themselves
The problem
An A2P SMS business lives on its gateways. Kannel connects to mobile operators (SMSC links), and smppbox or KSMPPD accept traffic from customers (ESMEs). Each one has an HTTP status page showing the current numbers, and that's all you get.
You can't answer "which customer is hitting its TPS limit?", "which operator link has been flapping all week?" or "why did delivery reports drop at 2 a.m.?" from a page that only shows the current moment.
Design
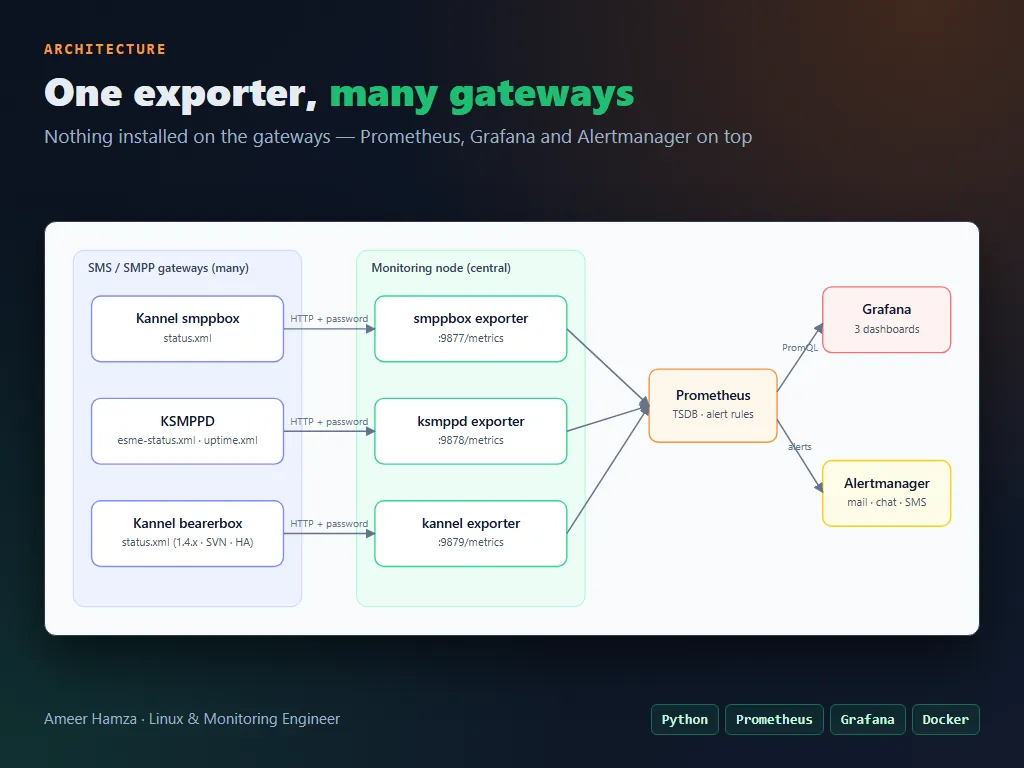
- Read, don't touch. Each exporter reads the gateway's existing status page (
status.xmloresme-status.xml) over HTTP and serves/metrics. The gateways need no changes. - Central or local. Run it on the gateway itself, or run one exporter that watches the whole fleet.
- Small. A single Python file per exporter, with two dependencies (
prometheus_client,PyYAML), a Docker image and systemd units.
The tricky part: counters that reset
smppbox resets a session's counters every time a customer reconnects. Pass those straight to Prometheus and rate() treats every reconnect as a counter reset, and graphs can show impossible spikes of billions of messages. The exporter tracks each session and keeps the totals it publishes monotonic, so rates stay correct across reconnects.
Dashboards and alerts
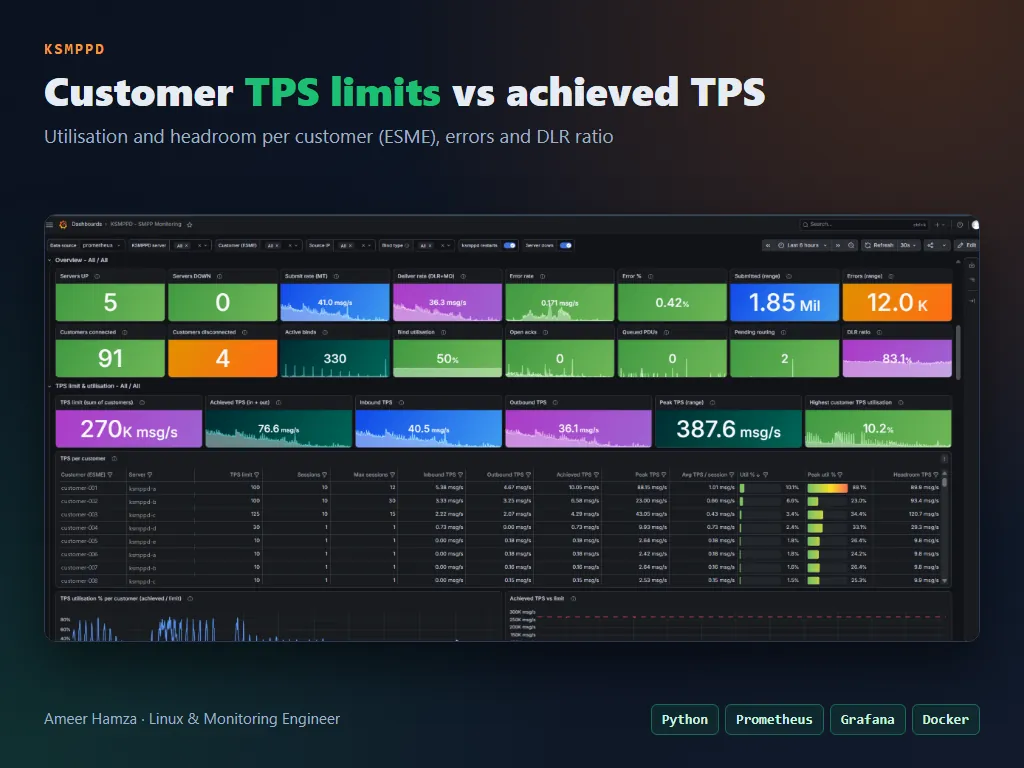
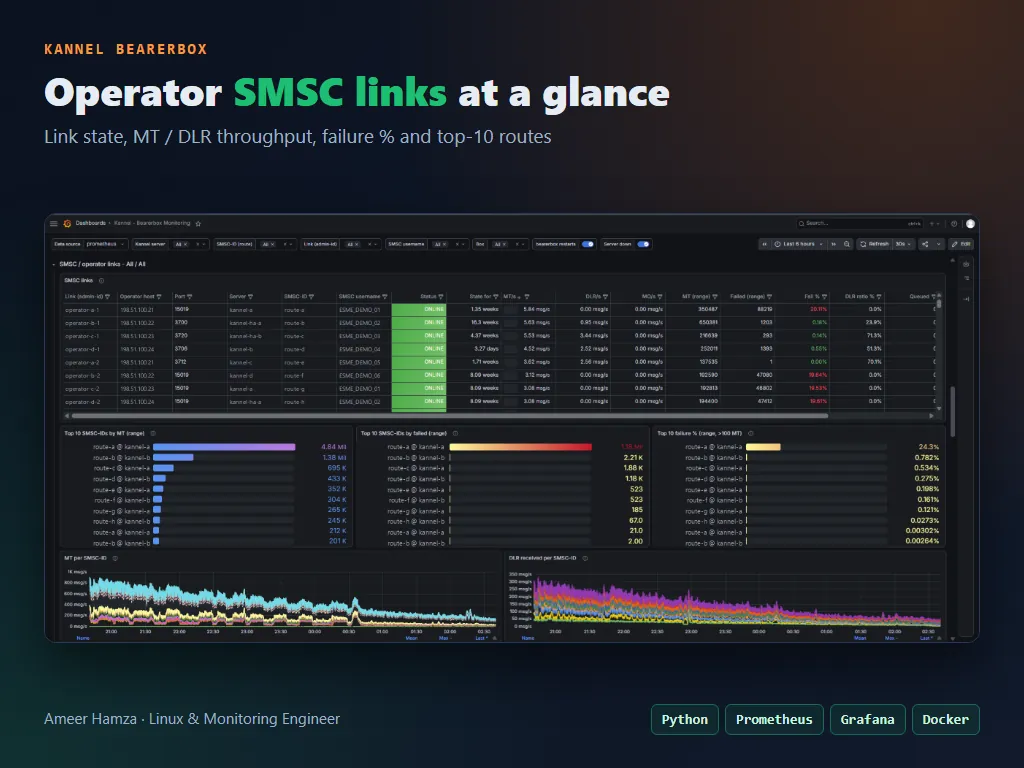
Each dashboard goes from all gateways → one server → one customer or link, using variables for server, customer, SMSC-ID and bind type. The alert rules cover what actually wakes people up: gateway down, an SMSC link down or flapping, growing queues, a customer disconnected, and TPS limits reached.
Making it usable by others
- A 60-second Docker demo with a mock gateway that generates realistic, fictional traffic, so anyone can try it without an SMS gateway.
- One-command install:
install.shsets up files, config, a systemd service and a test scrape. - CI, docs for each gateway, a metrics reference, troubleshooting, an FAQ and a security policy.
Outcome
It runs in production across our gateway fleet, watching hundreds of operator links and customer binds. Problems that used to be found by customers now show up as an alert first. It also works with Prometheus-compatible backends such as VictoriaMetrics, Mimir and Thanos.